
ScanGauge E
 Real-time Graphic Feedback
 Use Up To 33% less Fuel
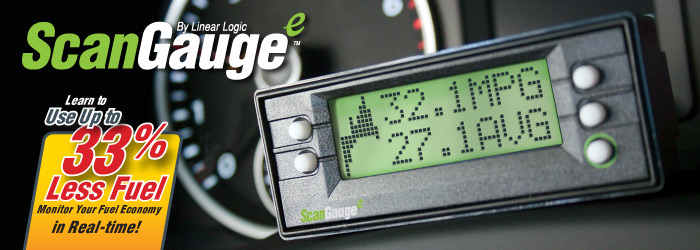
ScanGaugeE™ provides you with real-time information about your vehicle’s fuel economy through an intuitive graphic display. According to a report issued by the US government, adjusting your driving habits can increase fuel economy by up to 33%. Use the instant feedback provided by ScanGaugeE™ to adjust your driving style and improve your fuel economy.

 Track Your Fuel Cost
Track your fuel costs and fuel used in real-time. View information such as miles-per-gallon, gallons-per-hour and Trip Fuel Used. Track actual fuel costs with Trip-Fuel-Costs and Today’s-Fuel-Costs digital gauges.

 Monitor Your Carbon Footprint
Track your vehicle’s CO2 output in real-time. View information such as Current-CO2 and Trip-CO2. You can also track the days Total CO2 and Total CO2 for the tank within the built-in Trip Computers.

 An Ultra Compact Design that Installs In Minutes

ScanGaugeEinstalls in just minutes without tools and does not require batteries or an external power source. All data and power are derived from the single OBDII connection which is present on all 1996 and newer cars and light trucks.
ScanGaugeEinstalls in just minutes without tools and does not require batteries or an external power source. All data and power are derived from the single OBDII connection which is present on all 1996 and newer cars and light trucks. The detachable six (6) foot cord also allows ScanGaugeE™ to be mounted just about anywhere on the dash or console while staying connected to your vehicle. Below are just a few examples.
- Graphic Feedback
- Trip Computers
- Digital Gauges
Real-time Fuel Economy
 Graphic Feedback

ScanGaugeE™ provides you with real-time information about your vehicle’s fuel economy through an intuitive graphic display. Use the instant feedback provided to adjust your driving style and improve your fuel economy.
 Real-time Fuel Economy Feedback Graph
The graph represents your current average fuel economy over a period of time and is separated into 3 sections; (A) above your average, (B) at your average, and (C) below your current average.
As you drive, the graph will scroll to the left at regular intervals and provided feedback about your average fuel economy for the current trip. You goal should be to keep the graph above the Current Average (B) line. As your trip progresses, this may become increasing difficult as you raise your current average fuel economy.
 Goal Based Fuel Economy Feedback Graph
It is possible to set the Real-time Fuel Economy Graphic Feedback to display results based on a fuel efficiency goal.
When set in Goal mode, the Current Average (B) line represents your Fuel Efficiency Goal. The area above the Current Average (A) line represents fuel efficiency readings above your goal and the area below the Current Average (C) line represents fuel efficiency readings below your goal.
 Automatic Trip Computers

Five built-in trip computers keep track of everything from fuel cost, distance traveled your vehicle’s CO2 footprint and much more.
The CURRENT trip is restarted after the engine has been off for more than 3 minutes. The TODAY trip is restarted after the vehicle has not moved for 9 hours. The data from TODAY is moved to PREVIOUS DAY when it is restarted. This way, you don’t have to reset the trip computers when you start a trip. There is also a TANK Trip which you reset when you fill up the tank. It can provide you with “to empty” data as well as other useful information. The information is available anytime during the trip. The CURRENT trip can be reset. This is useful for making fuel economy measurements at a steady speed.
The TRIP modes in the ScanGauge can be used to save gas. Improved driving habits can improve fuel economy by up to 30% according to a US Government source. The ScanGauge lets you try different driving techniques and routes and gives quick feedback on how they affect fuel use.
| Built-in Trip Computers | |||
|---|---|---|---|
| Trip Computer | Display Name | Available Information | Display Name |
| Current | Current | Average Fuel Economy | FUEL ECO |
| Trip Fuel Used | FUEL USE | ||
| Today's Trip | TODAY | Maximum Coolant Temperature | WT MAX |
| Trip Distance | DIST | ||
| Maximum Engine RPM | MAX RPM | ||
| Previous Trip | PREV DAY | Trip Elapsed Time | HOURS |
| Maximum Speed | MAX SPD | ||
| Tank Trip | TANK | Average Speed | AVG SPD |
| Trip Fuel Cost | COST | ||
| Trip C02 Production | C02 | ||
| Tank To Empty | TO EMPTY | Fuel Remaining | FUEL |
| Distance Remaining Before Tank is Empty | DISTANCE | ||
| Time Remaining Before Tank is Empty | HOURS | ||
 Built-in Digital Gauges

The ScanGaugeE can display up to 2 digital gauges at one time along with the a real-time fuel efficiency feedback graph
The ScanGaugeE features more then 18 built-in digital gauges that can be displayed two at a time along with the real-time fuel efficiency feedback graph. The ScanGaugeE also features pre-defined gauge screens for fuel efficiency (MPG & AVG), CO2 production (CO2 & TCO) and Trip Cost (TFC & DFC) along with 2 custom screens you can use to setup your own default gauge set.
The gauges and the graph are updated in real-time as you drive to provide you the kind of real-time feedback that can help you learn to raise your fuel economy and reduce your carbon footprint – regardless of the type of vehicle you drive.
You can also change the unit of measure between standard and metric, as well as adjust the update rate to one of three pre-set speeds (slow, normal and fast).
| Digital Gauge | Name | Description |
|---|---|---|
| CLSD LP OPEN LP | Fuel System Loop Status | This indicates when the oxygen sensor is being used to control the mixture (closed-loop) and when it is not (open-loop). It is usually closed except when the engine is cold or under full throttle acceleration. |
| MAP | Manifold Absolute Pressure | This indicates the pressure in the intake manifold. It is reported in Pounds per Square Inch (PSI) by default but can be changed to kilo-pascals (KPA) if desired. |
| MPG KPG MPL LHK KPL | Miles Per Gallon Kilomteres Per Gallon Miles Per Liter Liters Per 100Km Kilomteres Per Liter | Instant fuel economy is updated about every 2 seconds at the NORMAL update rate . Small changes in throttle position or load while driving will show almost immediate changes in this gauge. |
| MPH KPH | Miles Per Hour Kilometers Per Hour | Speed in the units selected |
| RPM | Revolutions Per Minute | The RPM of the engine |
| TPS | Throttle Position Sensor | In some vehicles, a closed throttle will read 0 and full throttle will read 100. Other vehicles will have a higher value than 0 for a closed throttle and a full throttle value less than 100. |
| FWT CWT | Water Temperature | Water/Coolant temperature A vehicle with a 50/50 mix of coolant and water will not boil over until about 265˚ F at sea level. This will be reduced at higher elevations. |
| AVG | Average Fuel Economy | This is the current average fuel economy and is updated about every 2 seconds (normal rate). |
| TFC | Trip Fuel Cost | This is the total fuel cost for the current trip. |
| CPM | Cost Per Mile | Cost of fuel per mile at this time |
| VLT | Battery Voltage | Normal running battery voltage is between 13 and 15. When the engine is off it should be between 11 and 13. Voltages higher than 15 volts can damage batteries and electrical components. Voltages below 13 when the vehicle is running could indicate poor charging of the battery. Voltage below 11 when the engine is off could indicate a low battery charge or a shorted battery cell. |
| FIA CIA | Intake Air Temperature | Temperature of the air going into the engine. At highway speeds, this will typically be a few degrees higher than the outside air temperature. At idle or low speed, it may be much higher in temperature than the outside temperature due to the low airflow into the engine and the high under-hood temperatures warming it up. |
| FPR | Fuel Pressure | This is the fuel pressure from the fuel pump. Very few vehicles report this. |
| GPH LPH | Gallons Per Hour Liters Per Hour | Fuel consumption rate in the selected units. This is sensitive to throttle, gear and loading changes. |
| IGN | Ignition Timing | Shows the amount of timing advance (or retard). The more advance there is (or less retard), the better for fuel economy and power. The limit is set by the octane of the fuel, the intake air temperature, and the load on the engine. A lower than normal amount of advance for similar temperature and speed could indicate too low an octane of fuel is being used. |
| LOD | Engine Loading | This is a percentage of the maximum power available currently being generated. In some vehicles it is the maximum available at the present RPM. |
| DFC | Day's Fuel Cost | This is the total fuel cost for all trips for the current day |
| CO2 | Currnet Carbon Dioxide | This shows the amount of CO2 your vehicle has produced durring the current trip. |
| TCO | Today's Carbon Dioxide | This shows the total amount of CO2 your vehicle has produced durring the current day. |