
Real-time Graphic Feedback
 Use Up To 33% less Fuel

ScanGaugeE™ provides you with real-time information about your vehicle’s fuel economy through an intuitive graphic display. According to a report issued by the US government, adjusting your driving habits can increase fuel economy by up to 33%. Use the instant feedback provided by ScanGaugeE™ to adjust your driving style and improve your fuel economy.
 Track Your Fuel Cost

Track your fuel costs and fuel used in real-time. View information such as miles-per-gallon, gallons-per-hour and Trip Fuel Used. Track actual fuel costs with Trip-Fuel-Costs and Today’s-Fuel-Costs digital gauges.
 Monitor Your Carbon Footprint

Track your vehicle’s CO2 output in real-time. View information such as Current-CO2 and Trip-CO2. You can also track the days Total CO2 and Total CO2 for the tank within the built-in Trip Computers.
 An Ultra Compact Design that Installs In Minutes

ScanGaugeEinstalls in just minutes without tools and does not require batteries or an external power source. All data and power are derived from the single OBDII connection which is present on all 1996 and newer cars and light trucks.
The detachable six (6) foot cord also allows ScanGaugeE™ to be mounted just about anywhere on the dash or console while staying connected to your vehicle. Below are just a few examples.

- Graphic Feedback
- Trip Computers
- Digital Gauges
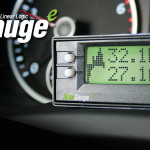
Real-time Fuel Economy
 Graphic Feedback

ScanGaugeE™ provides you with real-time information about your vehicle’s fuel economy through an intuitive graphic display. Use the instant feedback provided to adjust your driving style and improve your fuel economy.
 Real-time Fuel Economy Feedback Graph
The graph represents your current average fuel economy over a period of time and is separated into 3 sections; (A) above your average, (B) at your average, and (C) below your current average.
As you drive, the graph will scroll to the left at regular intervals and provided feedback about your average fuel economy for the current trip. You goal should be to keep the graph above the Current Average (B) line. As your trip progresses, this may become increasing difficult as you raise your current average fuel economy.
 Goal Based Fuel Economy Feedback Graph
It is possible to set the Real-time Fuel Economy Graphic Feedback to display results based on a fuel efficiency goal.
When set in Goal mode, the Current Average (B) line represents your Fuel Efficiency Goal. The area above the Current Average (A) line represents fuel efficiency readings above your goal and the area below the Current Average (C) line represents fuel efficiency readings below your go
Sorry, the comment form is closed at this time.